Heapviz: Interactive Heap Visualization
|
| Edward E. Aftandilian | Sean Kelley | Connor Gramazio | Nathan Ricci | Sara L. Su | Samuel Z. Guyer |
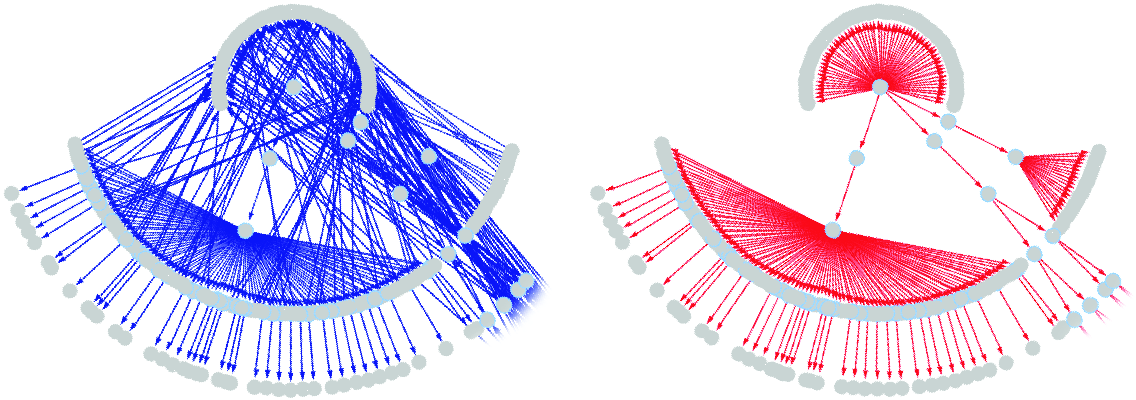
Figure 1: A Heapviz visualization of a Java program containing multiple data structures. On the left is the full graph of data objects generated from the heap snapshot. The graph on the right shows only the dominance edges Heapviz uses for graph layout; the dominance tree clearly separates the three data structures.
ABSTRACT
Understanding the data structures in a program is crucial to understanding how the program works, or why it doesn't work. Inspecting the code that implements the data structures, however, is an arduous task and often fails to yield insights into the global organization of a program's data. Inspecting the actual contents of the heap solves these problems, but presents a significant challenge of its own: finding an effective way to present the enormous number of objects it contains. In this paper we present Heapviz, a tool for visualizing and exploring snapshots of the heap obtained from running Java programs. Unlike existing tools, such as traditional debuggers, Heapviz presents a global view of the program state as a graph, together with powerful interactive capabilities for navigating it. Our tool employs several key techniques that help manage the scale of the data. First, we reduce the size and complexity of the graph by using algorithms inspired by static shape analysis to aggregate the nodes that make up a data structure. Second, we introduce a dominator-based layout scheme that emphasizes hierarchical containment and ownership relations. Finally, the interactive interface allows the user to expand and contract regions of the heap to modulate data structure detail, inspect individual objects and field values, and search for objects based on type or connectivity. Case studies show that Heapviz provides programmers with a powerful and intuitive tool for exploring program behavior.
FILES
|
|
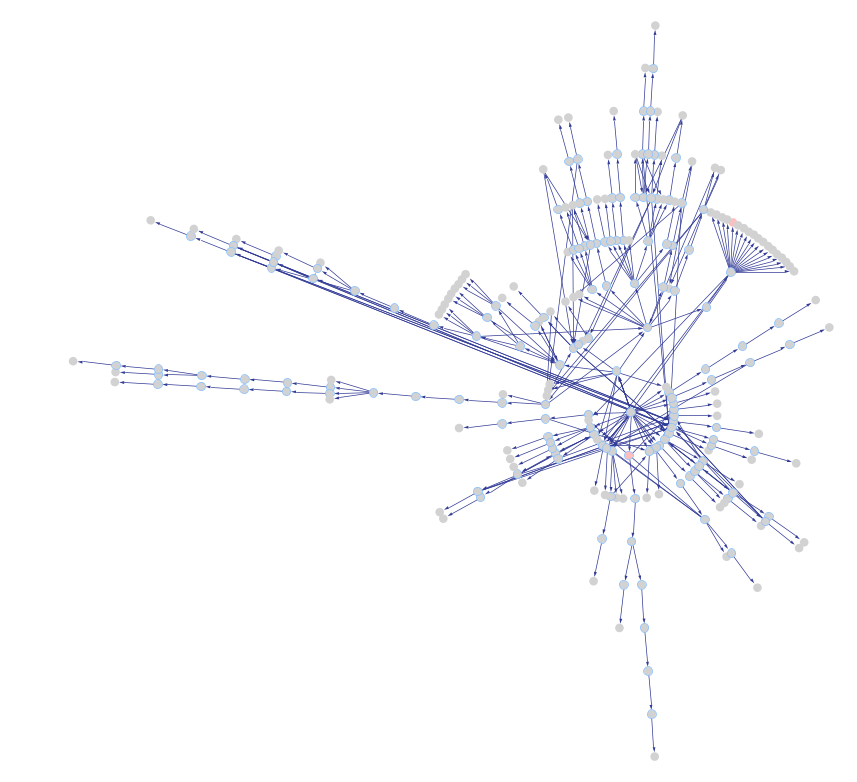
Figure 7: A summarized visualization of the _209_db benchmark, which contains 294,002 objects in the concrete heap at this point in program execution. The summarized graph contains only 254 nodes and is comprehensible using the interactive visualization. |

Figure 9: A summarized visualization of the SPEC JBB 2000 benchmark, which contains 117,819 objects in the concrete heap at this point in program execution. The summarized graph contains 7578 nodes. Although some large data structures are visible after this significant reduction, the graph is still cluttered. |
PUBLICATIONS
E. Aftandilian, S. Kelley, C. Gramazio, N. Ricci, S. Su, and S. Guyer. Heapviz: Interactive Heap Visualization for Program Understanding and Debugging. In Proceedings of the 5th ACM Symposium on Software Visualization (SOFTVIS), Salt Lake City, Utah, October 2010.
ACKNOWLEDGEMENTS
This research has been partially supported by the National Science Foundation under grant CCF-0916810. We thank Ben Schwalb, Mark Marron, and Audrey Girouard for their helpful discussions and comments.